
Anyone dealing with powders will sooner or later be confronted with the term Particle Size Distribution (PSD). This is especially true for powders of precious metals such as platinum powder. Below you will find out more about why you, as a powder user, should deal with PSD, what PSD is, and why powder is classified.
Why PSD may be important?
For most applications, such as in additive manufacturing or metal powder injection molding, the detailed knowledge of the particle size distribution is not necessary. Normally, at most the largest or smallest particle size is of interest. If powder is to be fed through a tube with a diameter of 125 µm, of course, no particle with a diameter of 125 µm may be included in the powder.
On the other hand, the so-called flowability of the powder is often decisive. Unfortunately, there is currently no universally applicable and at the same time reliable or informative measuring method for the flowability. As a crutch, one often uses particle size distribution on the assumption that flowability will be good enough if only the PSD is specified extensively enough.
Furthermore, the PSD of the powder „as is“ also influences the properties of the ready-to-use powder even after classification.
Invariably, for all applications, the price of the powder is of great importance. This is indirectly influenced by the achievable yield of the particle size distribution of the raw powder.
What is PSD?
Particle Size Distribution (formerly also called Grain Size Distribution) indicates which particle sizes are represented by which proportion in the entirety of the powder. Usually, the weight / mass fraction is given, but it is also easy to count the particles; without taking their weight into account, then there is a so-called number distribution.
An example for illustration
In the simplest case, for example, just sieving 1 kg of a metal powder in succession with 3 sieves of mesh sizes of 45 µm, 63 µm and 125 µm can yield 350 g at 45 µm, 150 g between 45 µm and 63 µm, 340 g between 63 µm and 125 µm and 160 g over 125 µm. This is in principle the frequency distribution, which indicates what proportion of the powder lies between an upper and a lower limit – in this case, 15% between 45 µm and 63 µm. If all weights or parts are added up to the grain size of interest, the cumulative distribution results. In the example, 35% is less than 45 µm, 50% less than 63 µm and 84% less than 125 µm. The following abbreviations are often used when talking about powder: „under“ = „<“ = „-“ and „over“ = „>“ = „+“. A powder + 45 / -125 is thus larger than 45 µm and smaller than 125 µm. If this procedure is carried out with significantly more than 3 interpolation points (for example with a modern measuring device), „smooth“ curves are obtained as shown below for the powder CuSn23.
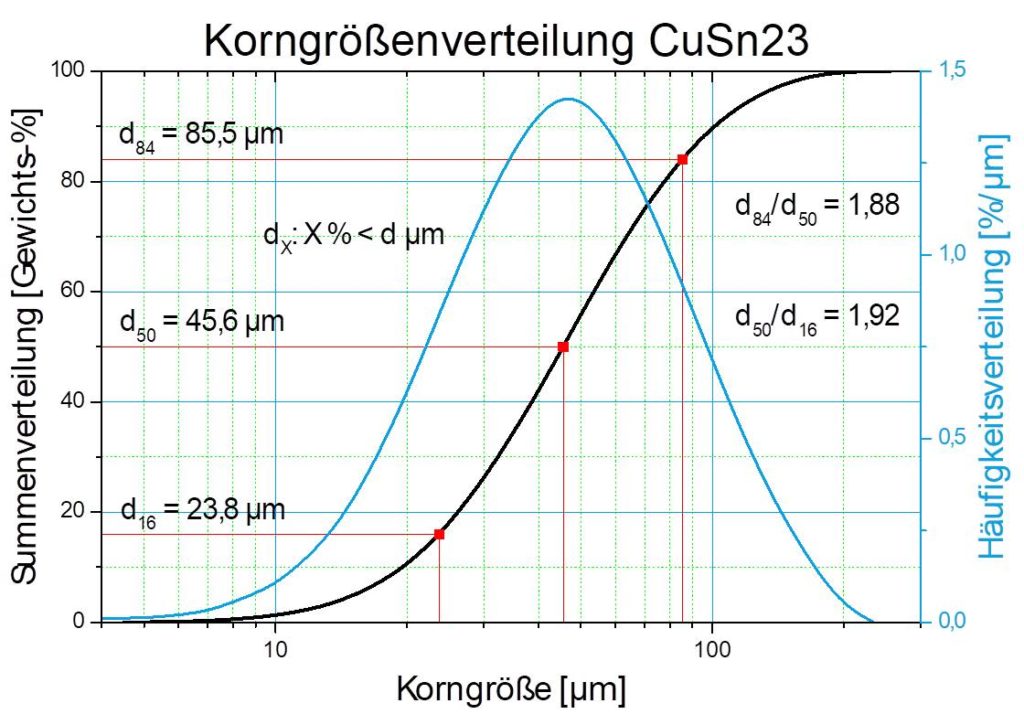
A size „dX“ indicates the diameter below which X% of the weight of the particles lie or – in the case of the number distribution – which number of particles is below this limit. The value d50 is referred to as mean particle size, since half of the total weight is attributed to particles smaller than this diameter and the other half to larger particles. When using a sieve of this mesh size, half the powder would fall through the sieve, the other half would remain on it. So d50 indicates where the PSD is on average – is the powder fine or coarse. d84, on the other hand, is the value which, in the case of a Gaussian distribution, is exactly one standard deviation from the mean. The quotient d84 / d50 is therefore a measure of the width of the PSD. These two specifications (or any other two values such as d10 and d90) fully describe the PSD. More values ??are not needed and, more importantly, cannot be strictly adhered to. A maximum of 2 values can be more or less exactly observed (= specified) whereas the adherence to further characteristic values is more of a random nature.
Why are powders classified?
PSD therefore only describes powder; it does not matter whether it is a powder directly from the manufacturing process or a powder in its final state and ready to use. There is usually a significant difference between the two powders: be it metal particles injection molding (MIM), where the particles have a maximum size (eg 25 µm) or that the particles must be within a certain range for additive manufacturing (+ 10 / – 45 µm). The link between the two powders is the process of so-called classification, in which the desired powder is „extracted“ from the total powder. The subsequent manufacturing process thus determines whether and, if so, how the raw powder must be classified. There are two main methods available: sieving and sighting. Broadly speaking, screening is carried out when the boundary at which it is to be separated is above a range of 30 µm to 40 µm. The sighting is selected if the limit is below the stated range, preferably even below 25 µm. In the next blog post „Precious Metal Powder: Effects of Particle Size Distribution on Flowability and Price“, we will go deeper into the importance of particle size distribution in different applications.